
Monitor ethOS Distro with Elastic Search - 3

Once we've set up the data sending from out ethOS machine, we can check that ElasticSearch collects data. With GET /ethos/_count, we get something like:
{
  "count": 5319,
  "_shards": {
    "total": 5,
    "successful": 5,
    "skipped": 0,
    "failed": 0
  }
}
If the count is greather than 0, we can start analysing the data.
Metrics
I am currently measuring only machine. Therefore, I've set up some simple measurements:
- Hash rate
- Temperature
- Network
- Fan speed
Hash rate
I am measuring the average sum of all GPUs' hash rates and the trend:
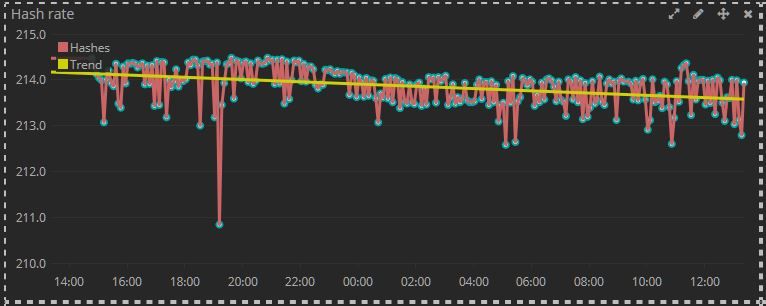
I've built this with Timelion and the code is:
.es(metric=avg:status.sum_hashes).points().label(),

.es(_exists_:status.sum_hashes).if(eq,0,null,
  .es(metric="sum:status.sum_hashes")
).fit(average).label("Hashes"),

.es(metric=avg:status.sum_hashes).trend(linear).label(Trend)
As you can see, there are three components:
- The first expression produces the (cyan) points in the picture.
- The second expression draws the (red) lines. In order to avoid jumping to 0 for empty datasets, I'm filtering out the null values.
- The last component produces the (yellow) trend line.
The tempratures
The second most important element is the temperature. To put it simple: the lower the temperatures, the better for the card.
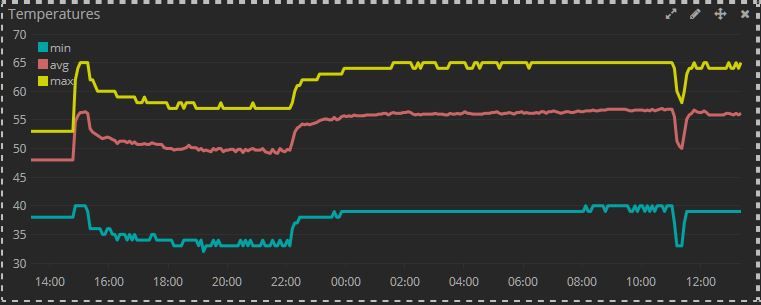
This was also created with timelion:
.es(_exists_:status.a_temp).if(eq, 0, null,
    .es(metric="min:status.a_temp")
).fit(average).label("min"),

.es(_exists_:status.a_temp).if(eq, 0, null,
    .es(metric="avg:status.a_temp")
).fit(average).label("avg"),

.es(_exists_:status.a_temp).if(eq, 0, null,
    .es(metric="max:status.a_temp")
).fit(average).label("max")
For this, I'm measuring also three components:
- the minimum
- The average
- The maximum
At the time of measurement, the rig is in an open space without dedicated air flow and, as you can see, the deperature varies. I am expecting that once the airflow is in place, the temperatures' gap will drop and they will be lower.
The network
Another measurement I am monitoring is the network traffic. This is not much, but I'll be able to see when the network is down:
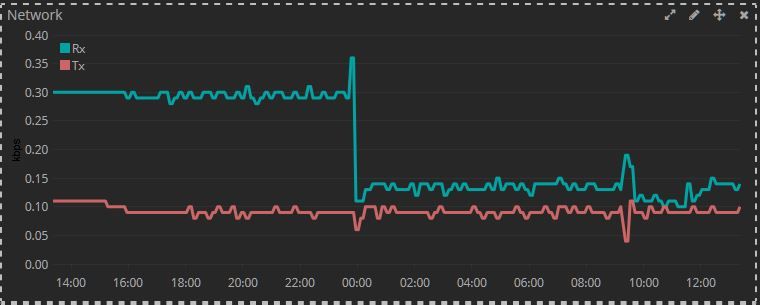
This is yet another Timelion graph:
.es(_exists_:status.val_rx_kbps).if(eq,0,null,
    .es(metric="sum:status.val_rx_kbps")
).fit(average).label("Rx"),

.es(_exists_:status.val_tx_kbps).if(eq,0,null,
    .es(metric="sum:status.val_tx_kbps")
).fit(average).label("Tx").yaxis(label="kbps")
It shows the sent and received data.
The fan speed
I've also decided to implement the fan speed as agauge, simply because my setting sets the fan speed at 50%:
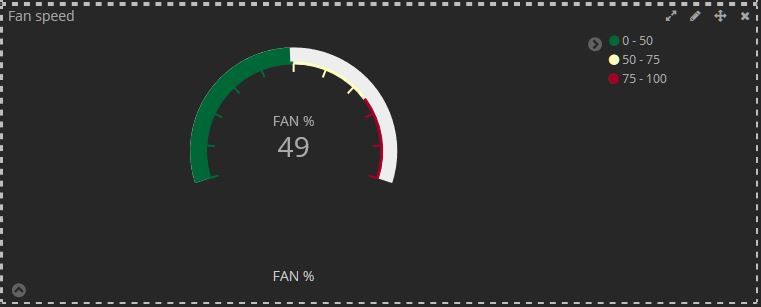
The metric is Average status.fan_percents.
HTH,