
Debug Electron in VS Code
TL;DR: You need to follow the server (electron) client (VS code debugger) approach. Be aware of OS specifics!
So far, my approach towards development/debugging would be to write some code, test it, rewrite, test... all with a bunch of console.log() statements. That's not efficient at all and since VS code has debugging capabilities, I've decided to find out how.
First, when you enter the debug mode, you're presented with a default configuration containing of two parts:
- A launch part - designed to launch your application
- An attach part - designed to attach the debugger to the launched process
Attach
I'll start with the attach segment because it's the simplest one:
{
  "name": "Attach",
  "type": "node",
  "request": "attach",
  "port": 5858,
  "sourceMaps": false,
  "outDir": null
}
It defines a listener on a port (5858 in this example) where the debugger lies.
Launch
The launcher configuration is bit more convoluted:
{
  "name": "Launch - electron",
  "type": "node",
  "request": "launch",
  "program": "${workspaceRoot}/src/electron/index.js",
  "stopOnEntry": false,
  "args": [],
  "cwd": "${workspaceRoot}",
  "runtimeExecutable": "${workspaceRoot}/node_modules/.bin/electron",
  "runtimeArgs": ["./src/electron", " --debug-brk=5858", " --enable-logging"],
  "env": {},
  "externalConsole": false,
  "sourceMaps": false,
  "outDir": null
}
This segment practically says:
- The program to be debugged is
${workspaceRoot}/src/electron/index.js(or whatever your electron main script is called) - Debug of type
node - The runtimeExecutable is
${workspaceRoot}/node_modules/.bin/electron(the electron binary, not yournodeone) - The runtimeArgs are the one described above. The most important one is
debug-brkwhich launches the debugger on the specified port
As a side note, --enable-logging allows us to print out console.log() statements :)
How To
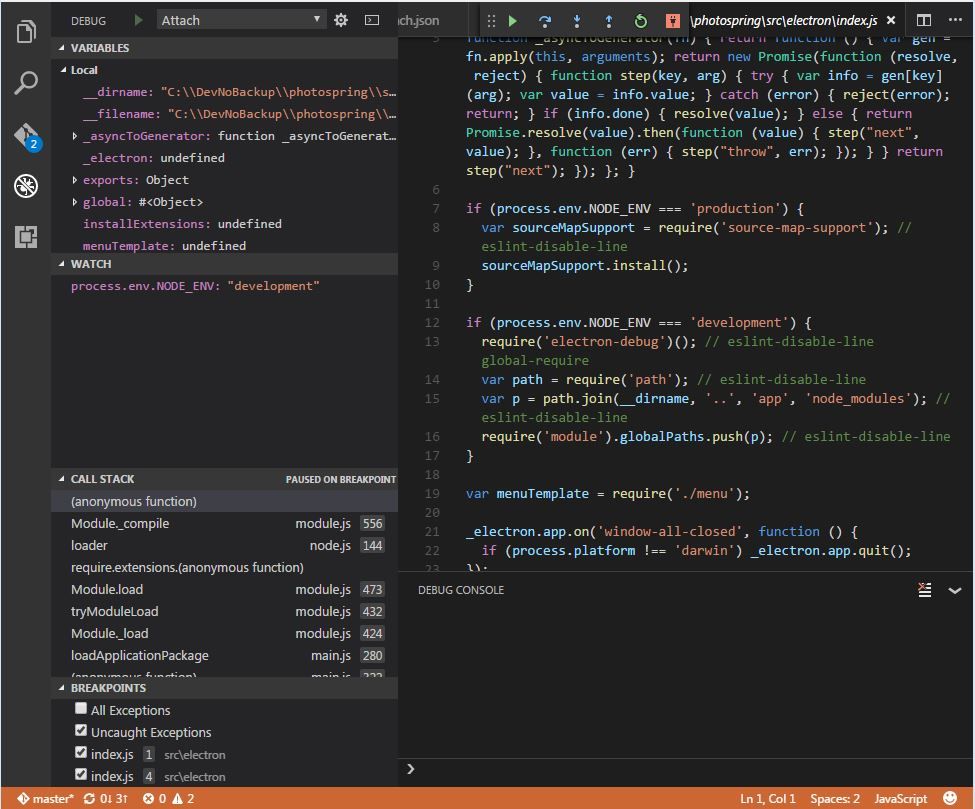
Once you have the configuration set up, you need to execute the Launch - electron:

and then the Attach configuration:

You'll get something like:
MS Windows Notes
On MS Windows, I get an error like:
Chrome error: Error: spawn c:\DevNoBackup\myapp/node_modules/.bin/electron ENOENT
You'll need to specify the extension:
"runtimeExecutable": "${workspaceRoot}/node_modules/.bin/electron.cmd",
in order to work. This is quite unpleasant and it makes the feature platform-dependent.
My solution was to specify the command in package.json:
"scripts": {
  ...
  "launch:e:dev": "cross-env NODE_ENV=development HOT=1 electron ./src/electron --debug-brk=5858",
  ...
}
This is also useful when you need to add in specific modules (like babel-register).
HTH,