
Monitor Docker Logs with ELK - 2
This second post in the series provides a starting point for visualising the log data. It makes some assumptions that logs are collected in a way described by the first part, so I would suggest to read through it if you haven't already.
Verify
First, make sure you have some data logged in:
-
You should have at least two indices:
yellow open logstash-2017.12.07 bipQpzoORQu8mcF63yV0Ng 5 1 2702848 0 1.1gb 1.1gb yellow open .kibana 9VqeDbHrTfSqDFE_pvs22A 1 1 2 0 14.1kb 14.1kb -
The Discover tab in Kibana should display some records. If it doesn't please adjust the Time Range (top right at the time of writing).
Tip: I set up a large window (e.g. "last 7 days") and then click-drag the relevant period of time:
Once you have the logs, open up Timelion and select the relevant time window (again, by setting up the Time Range).
Visualise
A starting point is to split the logs on INFO, WARNING, ERROR. The simplest Timelion config I could come up with is:
.es(q=message:DEBUG).points(), \
.es(q=message:INFO).points(), \
.es(q=message:WARNING).points(), \
.es(q=message:ERROR).points()
(remove the "" and new-line as the string needs to be on the same line if you want to just paste it).
I ran into two issues:
- The number of DEBUG messages was overwhelming
- A lot of 0 values popped up
After removing the DEBUG filter, I got:
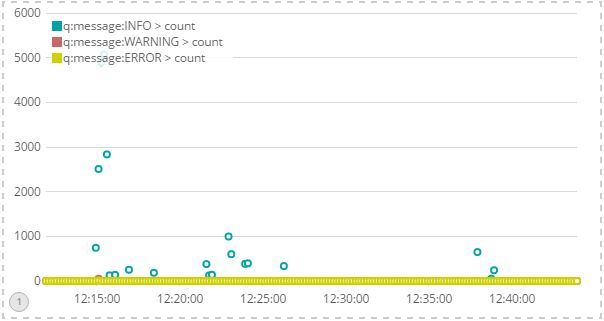
Unfortunately, most entries would have 0 values for the three log levels left. Therefore, I came up with a (convoluted) expression:
.es(q=message:INFO).if(eq, 0, null, .es(_exists_:message).if(eq, 0, null, .es(q=message:INFO,metric="count"))).points().label(INFO), \
.es(q=message:WARNING).if(eq, 0, null, .es(_exists_:message).if(eq, 0, null, .es(q=message:WARNING,metric="count"))).points().label(WARN), \
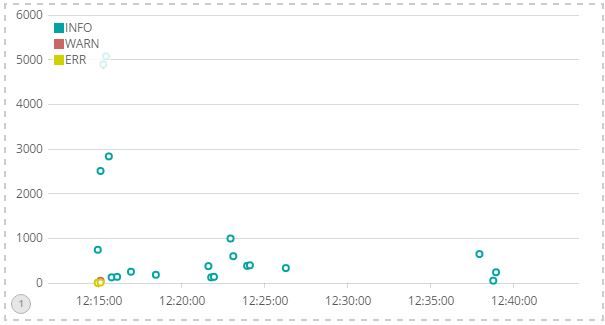
.es(q=message:ERROR).if(eq, 0, null, .es(_exists_:message).if(eq, 0, null, .es(q=message:ERROR,metric="count"))).points().label(ERR)
The result is much better now:
I've stopped here for the time being because I have a heterogeneous structure with NGINX, Apache, Django/Gunicorn and NPM. Following steps are to create logstash filters for the different types of logs...
A final note: One of the apps I left had debug messaging on (hence 2.5M entries). you might want to rotate the logs/indices.
HTH,